The Class Activity Dashboard is an overview of an individual student’s activity in a specific course. The dashboard contains the following data for:
- Activity: Number of times student course content or tools were used
- Class Average: Average usage for all student Activity
- Submissions: Gradable items submitted such as assignments or discussion forums
- Grades: Gradebook elements that were scored by the instructor
- Detailed History: Specific named events along with time duration and click interactions in table format (downloadable).
How to use the Dashboard
-
In your Blackboard course, navigate in the course menu to Course Tools -> Class Activity Dashboard
-
Choose the student whose data you would like to search.
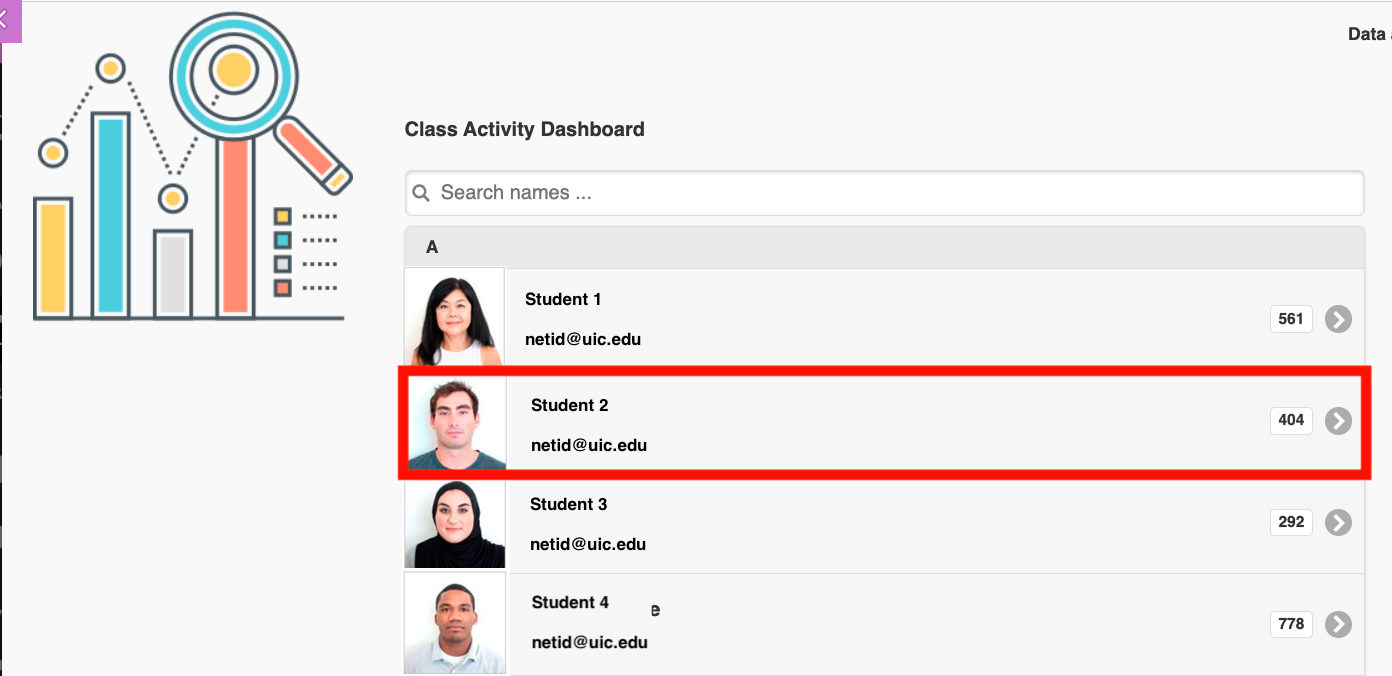
You can alternatively use the search bar to search for a specific student by name.

-
Once you have selected a student, all activity data from the beginning of the semester to the current date will be displayed.
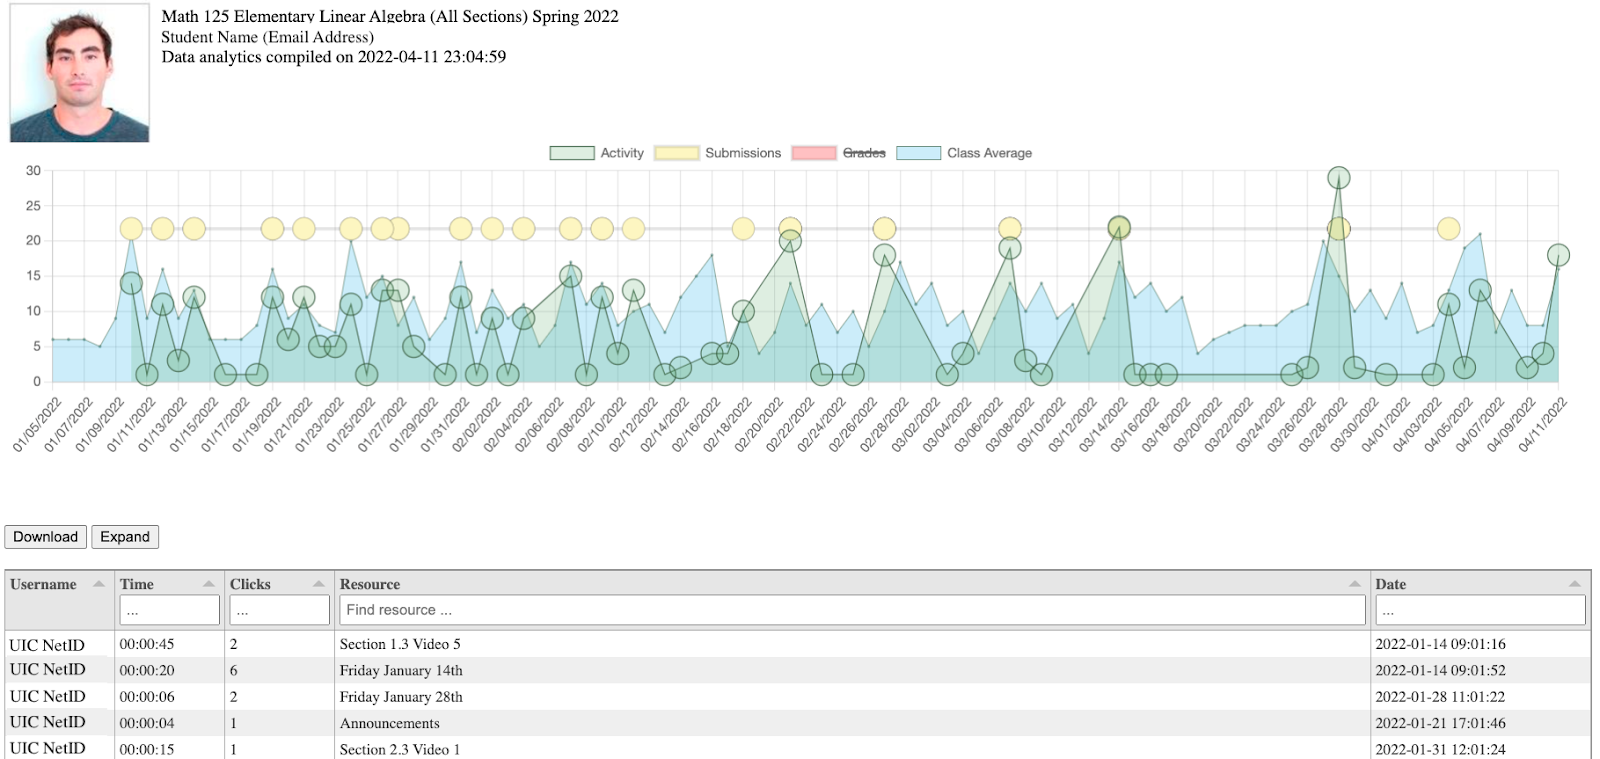
Dashboard Components
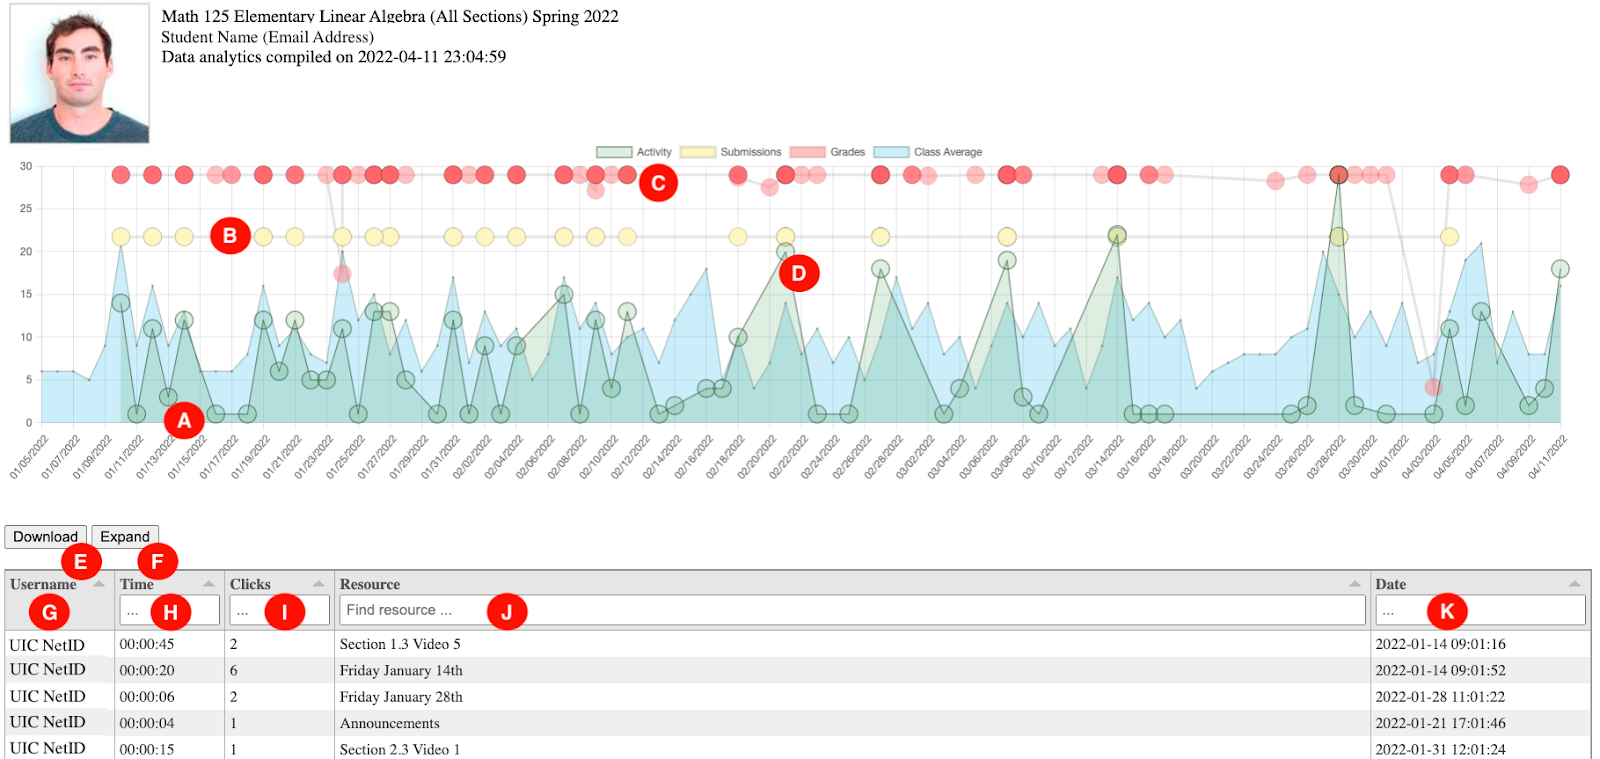
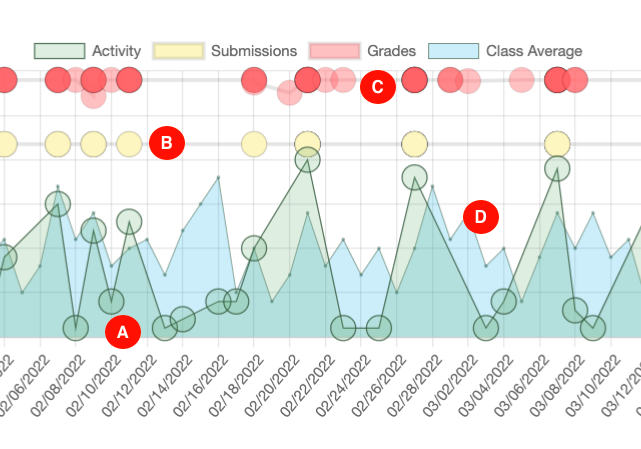
A. Activity: Number of times student course content or tools were used.
B. Class Average: Average usage for all student Activity.
C. Submissions: Gradable items submitted such as assignments or discussion forums.
D. Grades: Gradebook elements that were scored by the instructor.
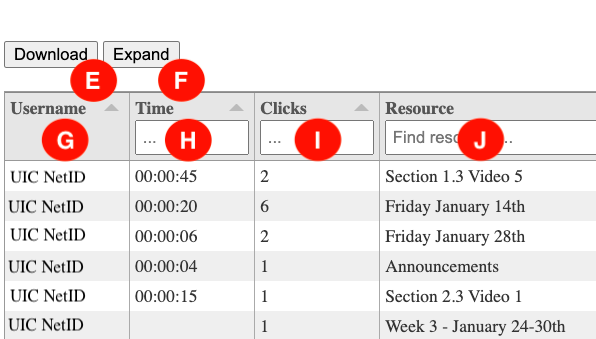
E. Download: Clicking this button will download the ENTIRE spreadsheet of data.
F. Expand: Clicking this button will allow the user to view all data on one page.
G. Username: Student NetID/email address.
H. Time: Amount of time in hours: minutes: seconds that the user spent between clicks. This is an approximate amount and does not reflect what the user was doing, just how much time passed since the last activity. Some events, especially longer-timed events, may reflect a browser window that was left open.
I. Clicks: Number of interactions that the user performed within a specific activity.
J. Resource: Name/Type of tool or activity that the student was interacting with.
K. Date: Date/Time that the activity was started by a student.
The dashboard is meant to be a tool to help you look at student performance and data in different ways.
Here are some use case scenarios:
-
Explore activity of students who have withdrawn from the course: By typing in “Withdrawn” into the search bar, the Dashboard will show students who dropped the course and would otherwise be hidden in the class.
-
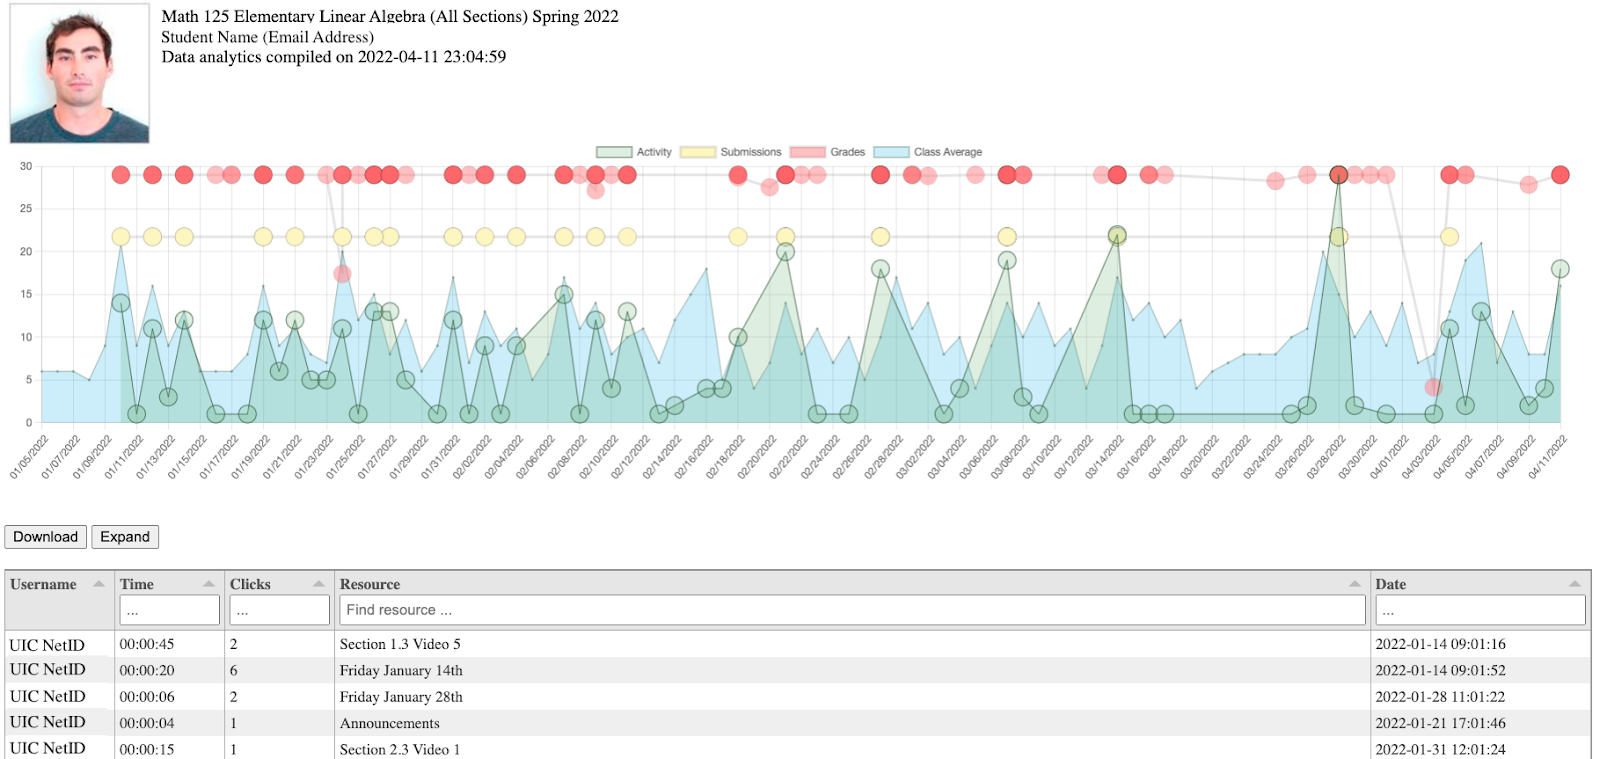
View a student’s activity chronologically: Student learning events are listed in one view from the start of the class to the current date. This indicates the correlation of effort (Activities) with submissions, and grades. The background of the class average provides a reference.
-
Find Grade outliers: Sometimes grades are posted by mistake (e.g. instead of 18 points, 180 is given. Or 100% is entered as -100%). The grade graph shows outlier grades that can be visually detected. The red series shows grades that are out of the common scale.
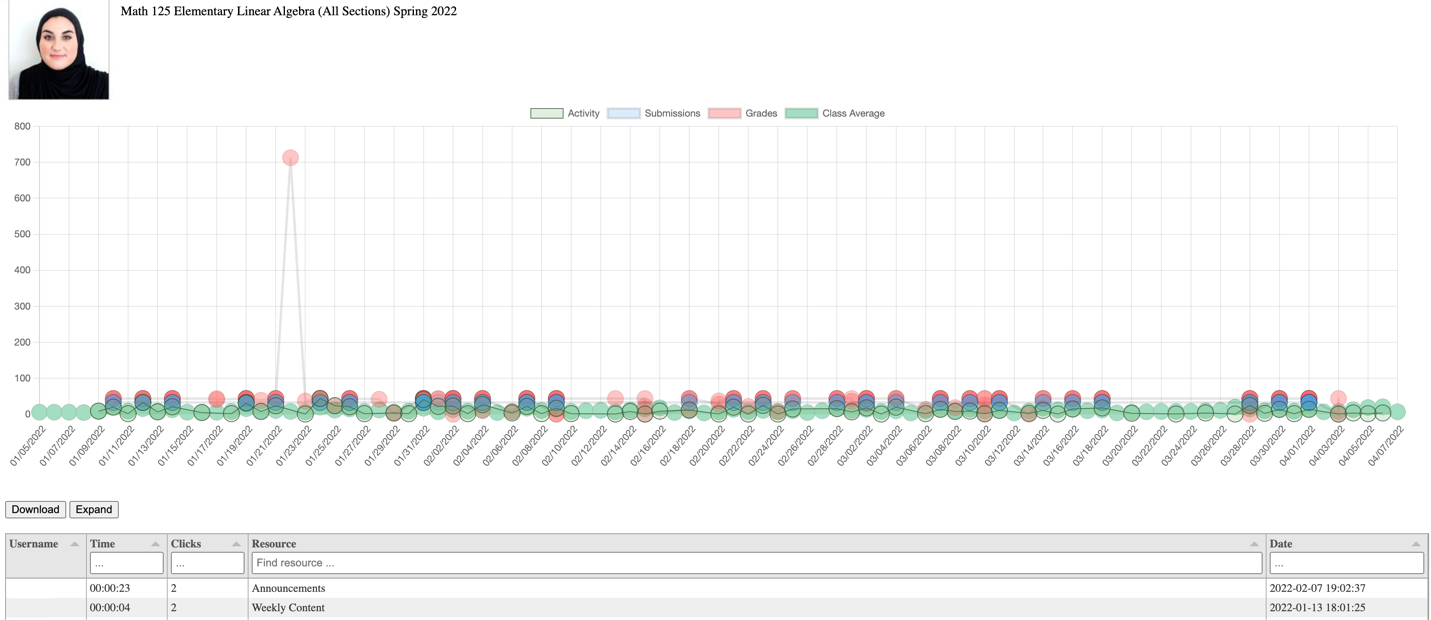
-
View Data in Excel: The individual events are named and dated in a history table. This table can be downloaded for additional reporting by the instructor.
-
Look at the relationship between activity and grading events: Green series shows Activity events. The red series shows grading events (dips in the red grading events show lower grades). Hovering over the grading events lists gradebook column names and scores.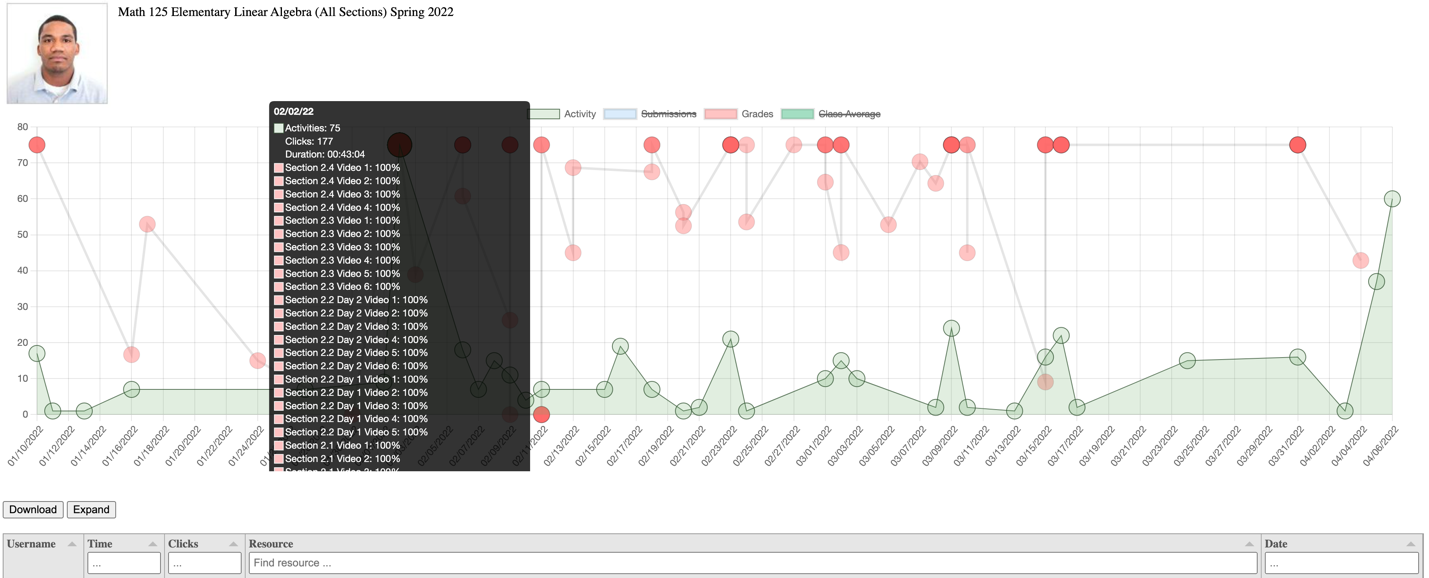
-
Manipulating the overlay of data: Each data series can be hidden by clicking on (or off) the legend.
-
Checking Activity events in relation to student submissions.
-
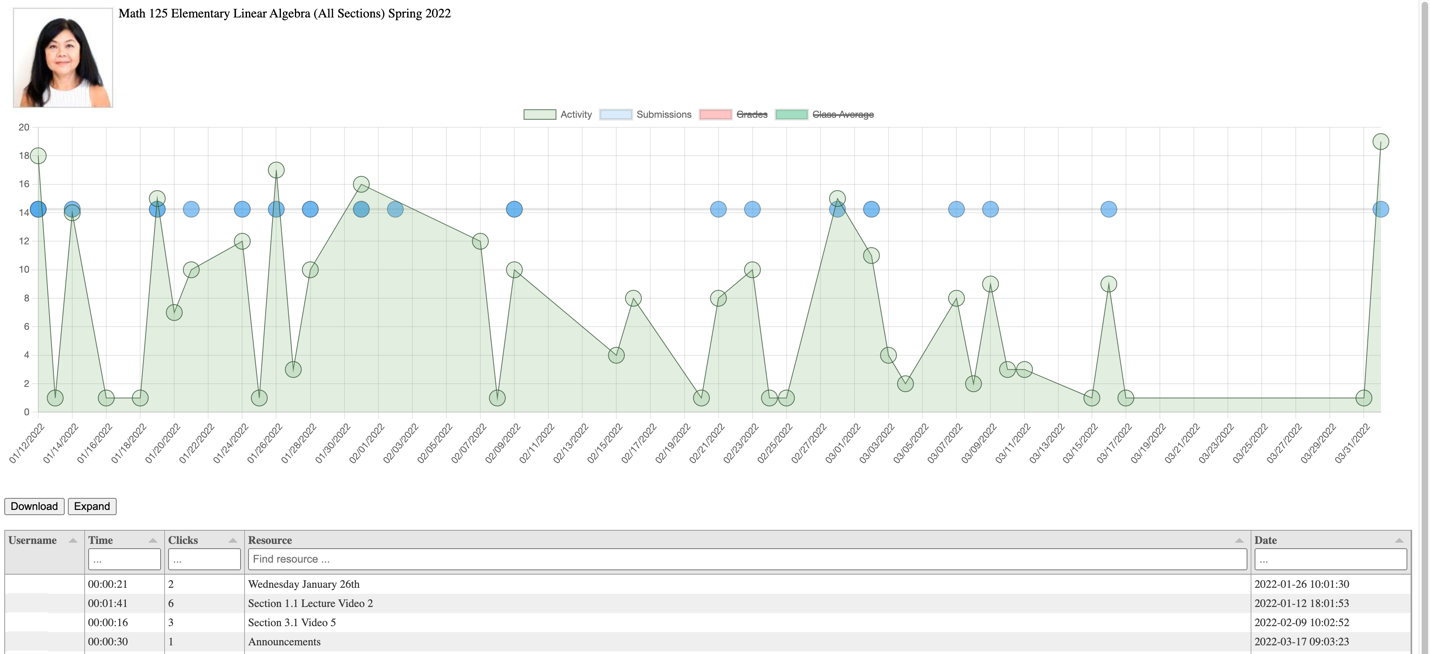
Comparing the Activity series with the background of Class Average.
-
Filtering the data in ascending/descending order: Track how much time is spent on various activities.

To learn more, please watch the video below: