Body
The Class Resources Dashboard is an overview of resource use in a specific course. The dashboard contains the following data:
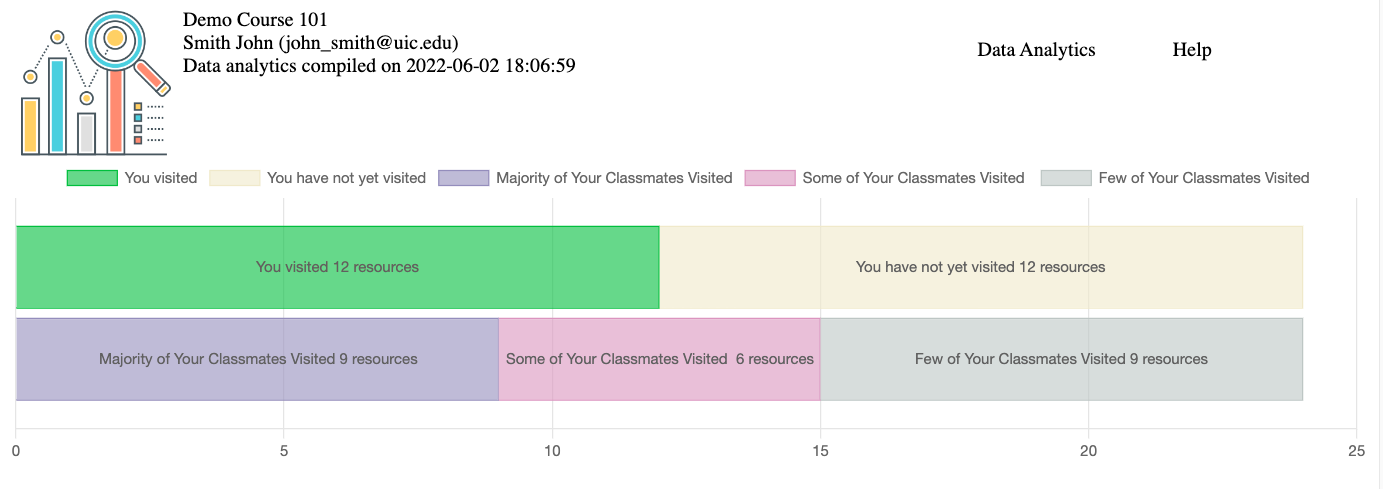
- Resources you visited: Number of Blackboard course areas (class activities and resources) you already visited
- Resources you have not yet visited: Number of Blackboard course areas you have not yet visited
- Resources Majority of your Classmates Visited: Number of Blackboard course areas that the majority (51-100%) of your classmates already visited
- Resources Some of your Classmates Visited: Number of Blackboard course areas that some (11-50%) of your classmates visited
- Resources Few of your Classmates Visited: Number of Blackboard course areas that just a few (10% or fewer) of your classmates visited

How to use the Dashboard:
-
In your Blackboard course, navigate in the course menu to Tools > Class Resources Dashboard.
-
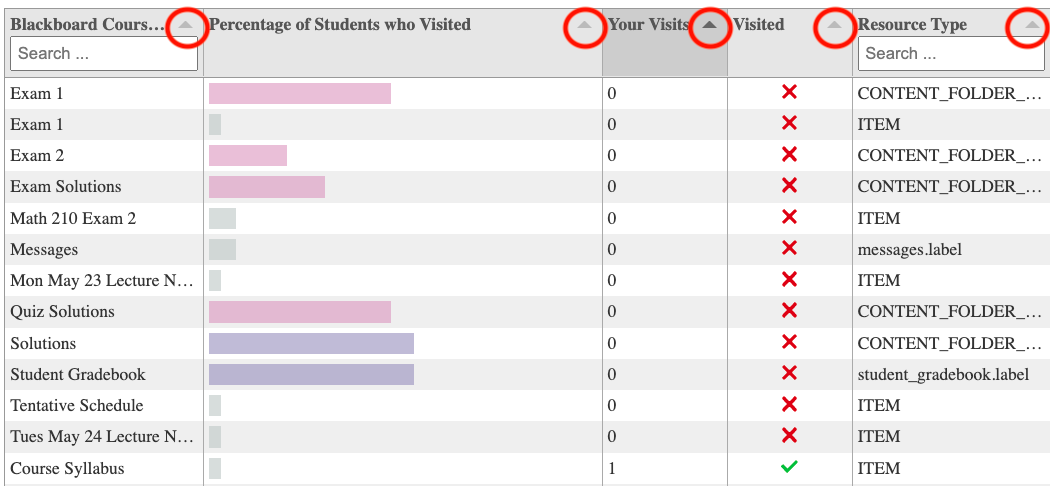
Use the various columns to sort and filter the results.

You can alternatively search in Blackboard Course Area or the Resource Type to search for a specific activity.

-
Once you have located an activity, the dashboard will indicate the percentage of students who have visited or clicked on the activity, the number of times you have visited the activity, and whether you have visited the activity or not. The dashboard is meant to be a tool to help you look at your student performance and data in different ways. Here are some following use case scenarios:
- Compare your activity to the rest of the class: the Dashboard will indicate your activity in comparison to the others in the class.

-
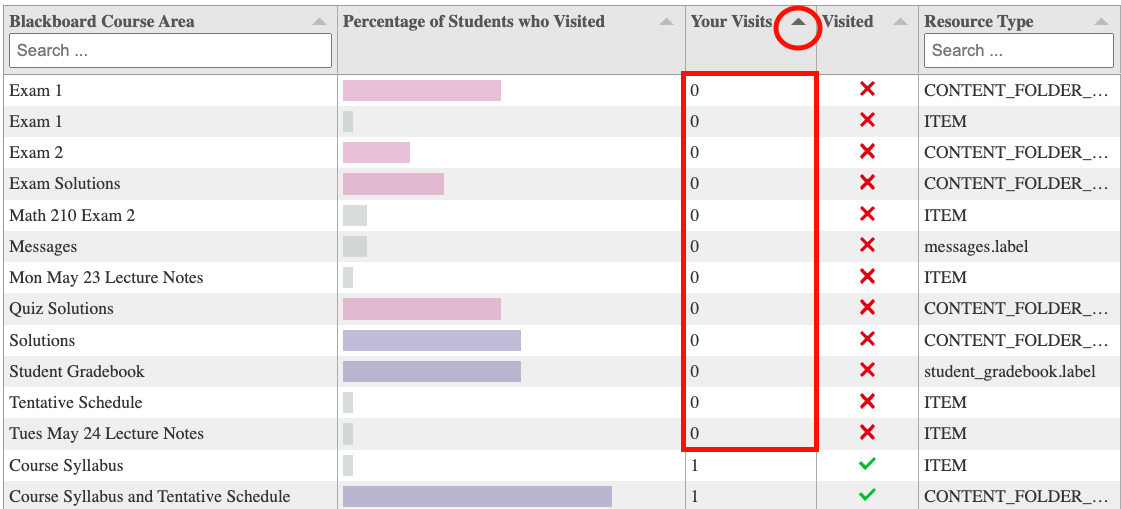
View the resources you may have missed: Toggle the Your Visits button to sort the column and find out if you missed clicking on any activities.
-
Interpret your activity results. The student visited 12 of the course areas. They may have missed important course information in the 12 other online resources/content. In looking at what the rest of the class is doing, the majority of the class visited 9 of the resources with another 6 resources seen by some of the class. The last 9 resources are rarely visited by the class (less than 10% view rate). The table below shows the details of the 12 missed resources and may indicate important course content that is not being seen by the student.

4. View Data in Excel: The individual events are named and dated in a history table. This table can be downloaded for additional reporting by the student. Click the Download button.